Photonic Crystal Fiber
This BeamLab demo shows the beam propagation through a photonic crystal fiber when illuminating its input facet with a Gaussian beam.
BeamLab demo: photonic_crystal_fiber.m
The propagation structure represents a photonic crystal fiber consisting of a triangular lattice of air holes where the central hole is missing. In the 3D refractive index contour plot, the air holes are indicated by green tubes, while the boundary between inner and outer cladding with refractive indices of 1.45 and 1.50, respectively, is represented by a purple tube.
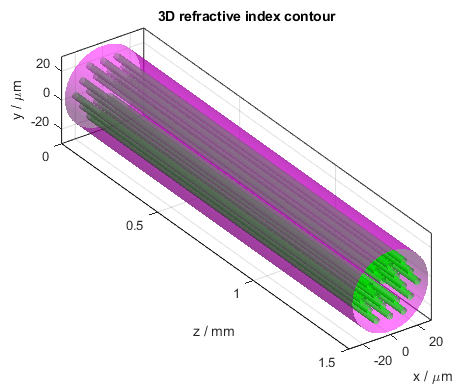
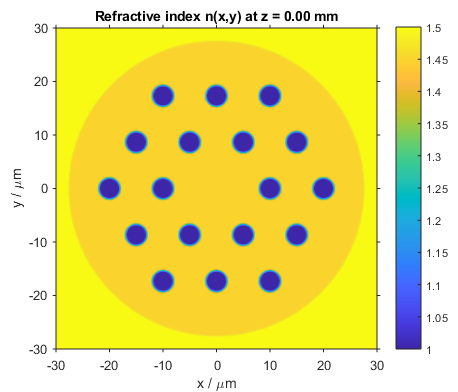
3D refractive index contour (left) and 2D refractive index profile (right) of the photonic crystal fiber
The following video shows how the intensity distribution changes along the propagation distance z. The figure shows the two-dimensional intensity distribution I(x,y) normalized to the input intensity and displayed on a logarithmic scale from -20 dB to 0 dB. The white lines indicate the locations of the air holes and the boundary between inner and outer cladding.
Video of the intensity profile of the beam propagating in the photonic crystal fiber
After the calculation has finished, the intensity distribution at the output of the propagation structure is plotted. This figure shows the intensity distribution I(x,y) at z = 1.5 mm.
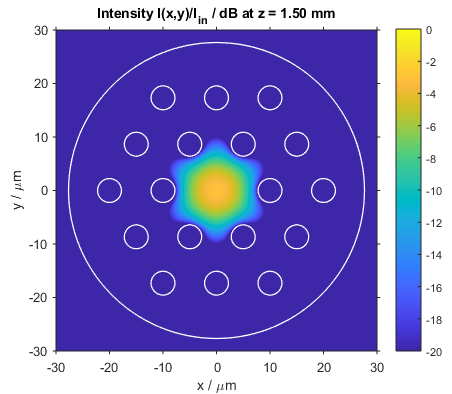
Intensity distribution at the output of the photonic crystal fiber (x–y slice)
About BeamLab
BeamLab is an award-winning set of simulation tools for beam propagation through optical devices and waveguides in your familiar MATLAB® environment. It offers a high flexibility in waveguide design and post-processing of any output data.