Meander Waveguide
This BeamLab demo shows a waveguide with a user-defined cross-section and a sinusoidally oscillating waveguide center. The fundamental mode is launched into the user-defined trapezoidal multi-mode waveguide and then partly coupled to higher-order modes in the meander section. After the meander section an adiabatic transition to a low-index single-mode waveguide strips the excited higher-order modes from the fundamental mode.
BeamLab demo: meander.m
The propagation structure consists of a custom waveguide with a trapezoidal core. The waveguide center as a function of the distance z follows first a straight line, then a sinusoidally oscillating curve, and finally another straight line. In the last propagation section, the refractive index of the trapezoidal waveguide is continuously decreased as a function of the distance z. Only a few lines of MATLAB® code are required for defining both the trapezoidal core shape and the meander waveguide center.
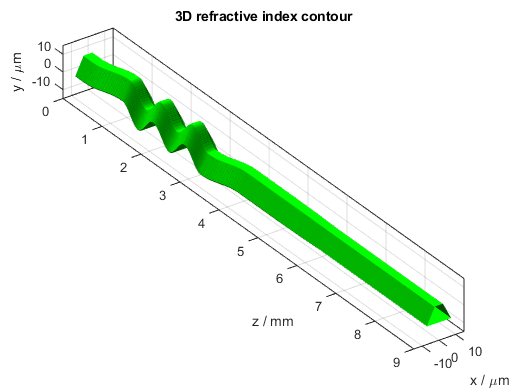
3D refractive index contour of the meander waveguide
The following video shows how the intensity distribution changes along the propagation distance z. The figure shows the two-dimensional intensity distribution I(x,y) normalized to the input intensity and displayed on a logarithmic scale from -20 dB to 0 dB. The white lines indicate the location of the waveguide.
Video of the intensity profile of the beam propagating in the meander waveguide
After the calculation has finished, the intensity distribution as a function of propagation distance z is plotted. The following figure depicts the intensity distribution I(x,z) at y = 0 µm. The white lines indicate the locations of the waveguides.
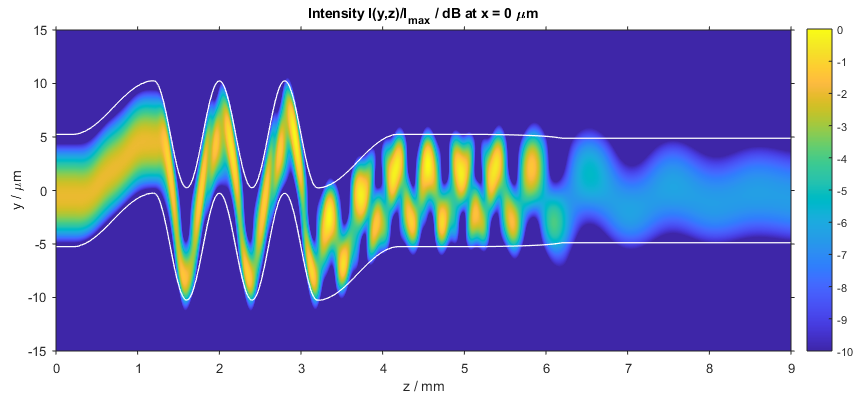
Intensity distribution in the meander waveguide (x–z slice)
The following figure shows a compact three-dimensional view of stacked plots, each portraying the intensity distribution I(x,y) at different distances z.
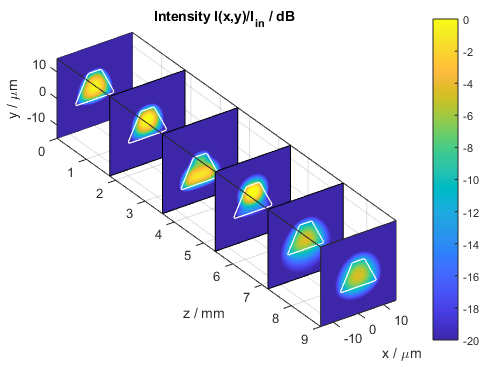
Intensity distribution in the meander waveguide (stacked x–y slices)
About BeamLab
BeamLab is an award-winning set of simulation tools for beam propagation through optical devices and waveguides in your familiar MATLAB® environment. It offers a high flexibility in waveguide design and post-processing of any output data.