Mach-Zehnder Modulator
This BeamLab demo shows the beam propagation through a Mach-Zehnder waveguide modulator while a phase shift of π is applied through a refractive index change to one of its arms.
BeamLab demo : mach_zehnder_modulator.m
The propagation structure consists of single-mode waveguides with square shaped cores and rounded corners. A single waveguide at the input is split up into two equivalent waveguides sufficiently separated from each other to act as uncoupled interferometer arms. Depending on the switching status of the modulator, the refractive index of both core and cladding can be modulated in one arm (not shown in the index contour plot). The strength of the index modulation together with the length of the interferometer arm is chosen such that the light has a phase shift of π at the point where the interferometer arms merge again to form the single output waveguide.
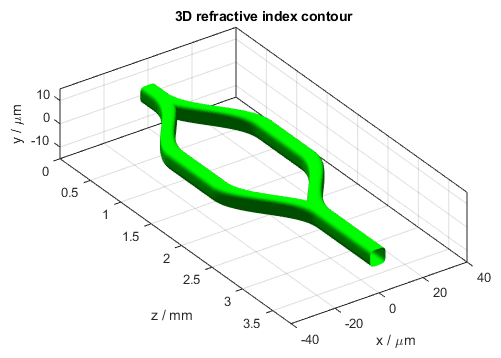
3D refractive index contour of the Mach-Zehnder modulator
Mach-Zehnder modulator switched off
The following video shows how the intensity distribution changes along the propagation distance z when the modulator is switched to the state of minimum throughput. The two figures on the left depict the refractive index distribution as a two-dimensional cross section n(x,y) (top left) and a one-dimensional index distribution n(x) at y = 0 µm (bottom left). The two figures on the right show the two-dimensional intensity distribution I(x,y) (top right) and the one-dimensional intensity distribution I(x) at y = 0 µm (bottom right). All distributions are normalized to the input intensity and displayed on a logarithmic scale from -20 dB to 0 dB. The white lines in the top left figure indicate the locations of the waveguides.
Video of 2D (top left) and 1D (bottom left) refractive index profiles and 2D (top right) and 1D (bottom right) intensity profiles
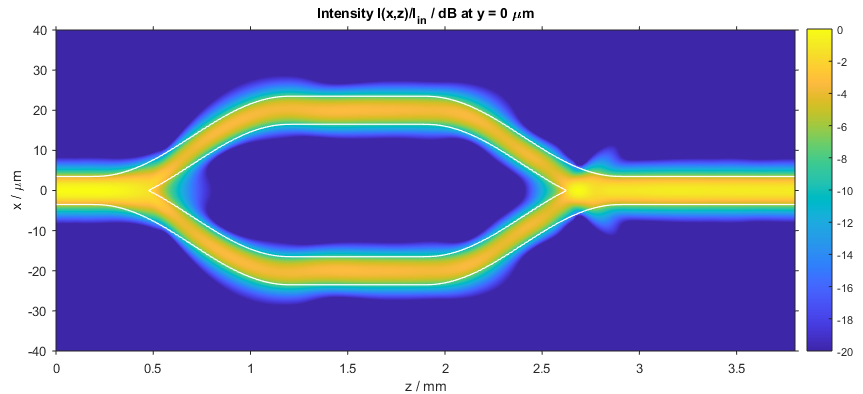
After the calculation has finished, the intensity distribution as a function of propagation distance z is plotted. The figure below shows the intensity distribution I(x,z) at y = 0 µm when the modulator is switched to the state of destructive interference at the output arm, i.e., the state of minimum power throughput. The white lines indicate the location of the waveguide.
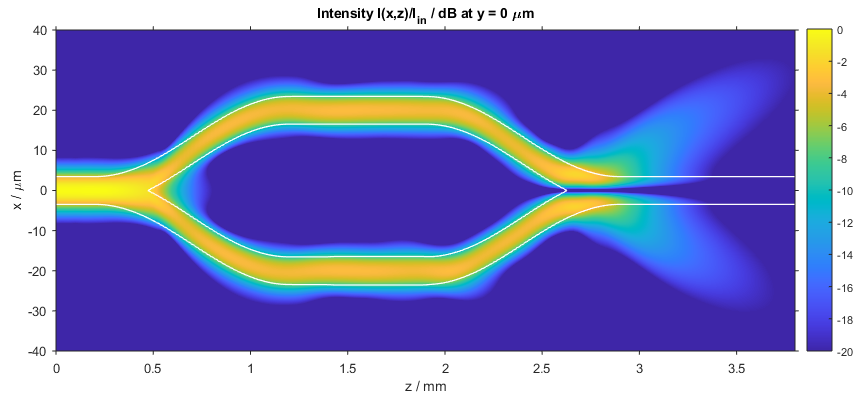
Intensity distribution in the Mach-Zehnder modulator (x–z slice)
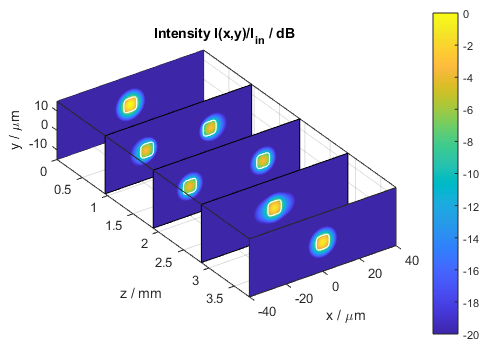
The following figure shows a compact three-dimensional view of stacked plots, each portraying the intensity distribution I(x,y) at different distances z.
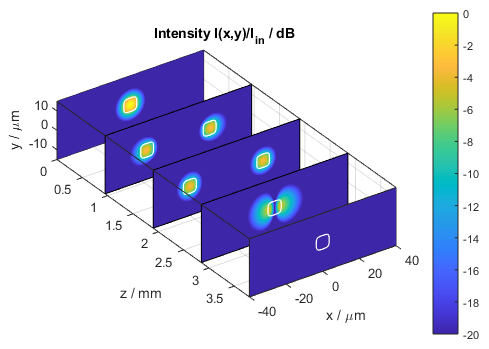
Intensity distribution in the Mach-Zehnder modulator (stacked x–y slices)
Finally, the power in each core can also be independently traced during a calculation. In the figure below, the blue curve represents the power in the arm located in the positive x region calculated over a circular area of the same extension as the waveguide core. The red curve represents the power in the second interferometer arm. Note that in this case the red curve is only displayed over the region where the waveguides centers do not overlap.
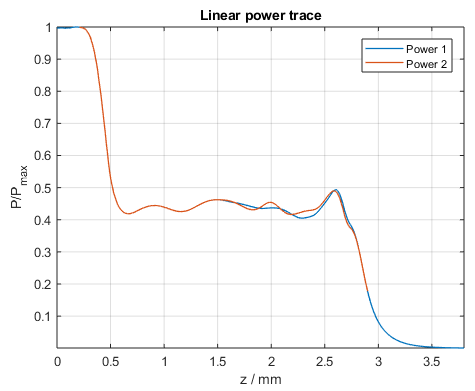
Power in each waveguide core of the Mach-Zehnder modulator
Mach-Zehnder modulator switched on
The following video shows how the intensity distribution changes along the propagation distance z when the modulator is switched to the state of maximum throughput.
Video of 2D (top left) and 1D (bottom left) refractive index profiles and 2D (top right) and 1D (bottom right) intensity profiles
Here again, the figure below shows the intensity distribution I(x,z) at y = 0 µm when the modulator is switched to the state of constructive interference at the output arm, i.e., the state of maximum power throughput.
Intensity distribution in the Mach-Zehnder modulator (x–z slice)
The following figure shows a compact three-dimensional view of stacked plots, each portraying the intensity distribution I(x,y) at different distances z.
Intensity distribution in the Mach-Zehnder modulator (stacked x–y slices)
About BeamLab
BeamLab is an award-winning set of simulation tools for beam propagation through optical devices and waveguides in your familiar MATLAB® environment. It offers a high flexibility in waveguide design and post-processing of any output data.