Directional Coupler
This BeamLab demo shows the coupling from the LP01 mode of a single-mode circular waveguide to the LP11 mode of a multi-mode circular waveguide. First, the LP01 mode of the single-mode waveguide is calculated for a wavelength of λ = 1.55 μm and used as input for the following beam propagation method (BPM) simulation. During the beam propagation, the LP01 mode of the single-mode waveguide then couples to the LP11 mode of an adjacent multi-mode waveguide.
BeamLab demo: directional_coupler.m
The propagation structure consists of a single-mode waveguide and a multi-mode waveguide with twice the core diameter. While the waveguides are sufficiently separated at the begin and at the end of the propagation structure to be considered uncoupled, they are located close enough to each other in the coupling region to obtain nearly 100% power coupling from one waveguide to the other over a distance of 4 mm.
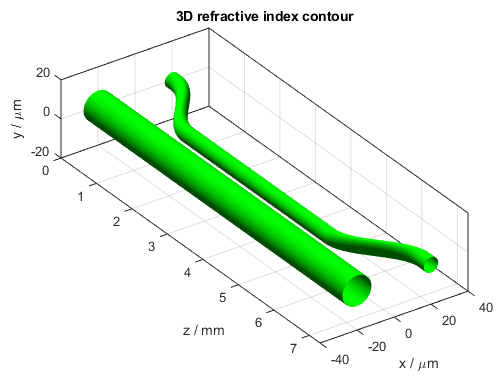
3D refractive index contour of the co-directional waveguide coupler
The following video shows how the intensity distribution changes along the propagation distance z. The top left figure depicts the two-dimensional cross section of the refractive index distribution. The top right and bottom left figures show the intensity distribution I(x,y) in a two-dimensional and three-dimensional view, respectively. The bottom right figure shows the one-dimensional intensity distribution I(x) at y = 0 µm. All distributions are normalized to the input intensity and displayed on a logarithmic scale from -20 dB to 0 dB. The white lines in the top right figure indicate the locations of the waveguides.
Video of refractive index (top left) and 2D (top right), 3D (bottom left), and 1D (bottom right) intensity profiles
After the calculation has finished, the intensity distribution as a function of propagation distance z is plotted. The following figure depicts the intensity distribution I(x,z) at y = 0 µm. The white lines indicate the locations of the waveguides.
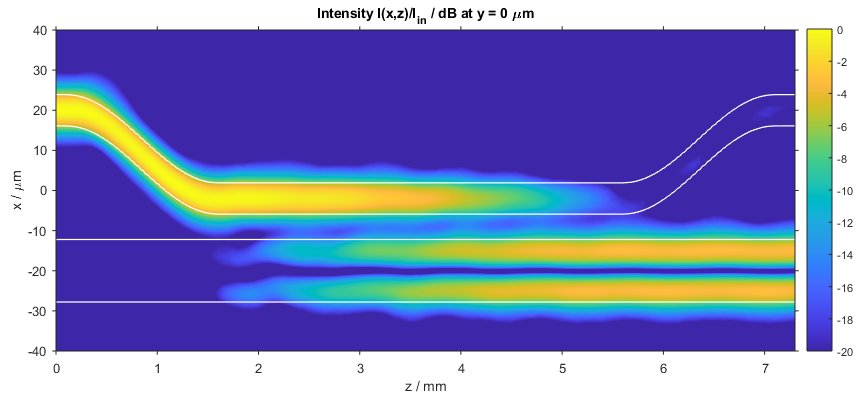
Intensity distribution in the co-directional waveguide coupler (x–z slice)
The following figure shows a compact three-dimensional view of stacked plots, each portraying the intensity distribution I(x,y) at different distances z.
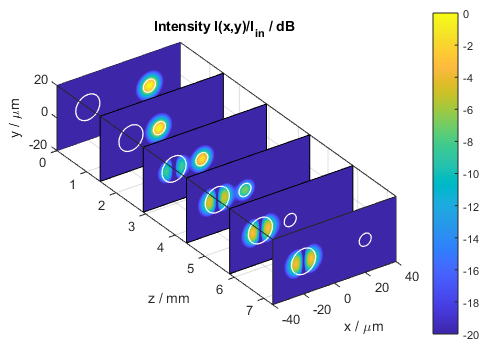
Intensity distribution in the co-directional waveguide coupler (stacked x–y slices)
The power in each waveguide can be independently traced during a calculation. In this example, the blue curve represents the power in the single-mode waveguide calculated over a circular area 2 times the diameter of the single-mode waveguide, and the red curve represents the power in the multi-mode waveguide calculated over a circular area 1.5 times the diameter of the multi-mode waveguide. The results show that nearly 100% of the power is coupled from one waveguide to the other.
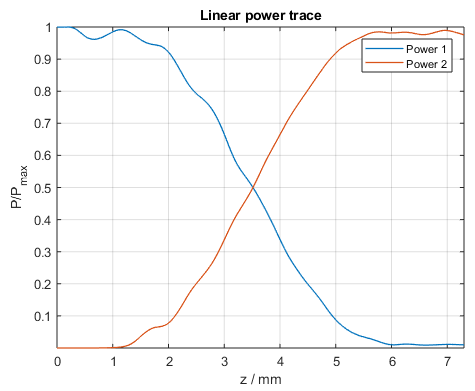
Power in each waveguide core of the co-directional waveguide coupler
About BeamLab
BeamLab is an award-winning set of simulation tools for beam propagation through optical devices and waveguides in your familiar MATLAB® environment. It offers a high flexibility in waveguide design and post-processing of any output data.